
Table of Contents
The influence of the position with respect to inert gas flow to fatigue performance of DMLS/SLM products
This page discusses the influence of position of products with respect to inert gas flow to fatigue performance of products made by DMLS/SLM technology. The studies of the problem are still in its initial phase, so that the data are still scarce and the conclusions are not definite.
The fatigue performance of maraging steel MS1 products manufactured by DMLS/SLM technology might be slightly higher if the products are placed closer to the outlet of the inert gas flow during the manufacturing process.
Mechanism of the influence
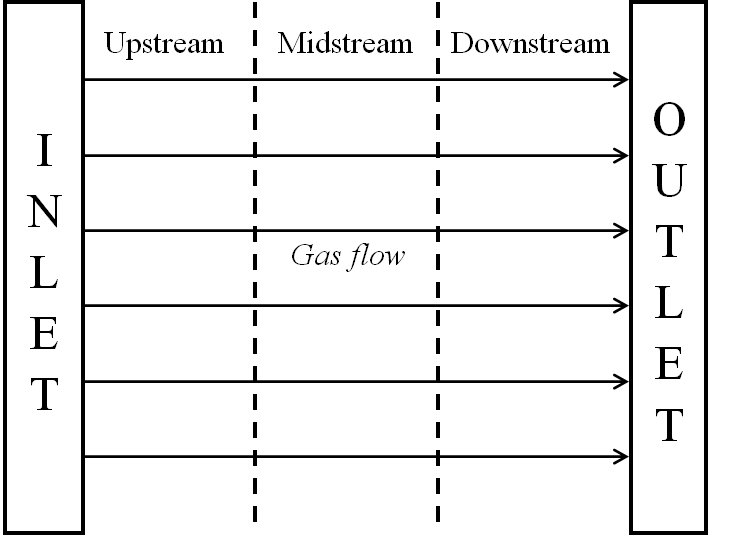
In the following text, the position of a product in the production chamber with respect to the inert gas flow (used to remove the burnt particles created during the laser sintering process) is classified as upstream, midstream or downstream (as explained in the figure below). Due to their mass, the inert gas flow cannot remove all the burnt particles from the production chamber. Since the burnt particles may be incorporated into a manufactured sample and act as material defects and sources of initial cracks, the products manufactured in different positions along the path of the gas flow may have different fatigue performances.
S-N curves and fatigue limits
The following table presents the results of the studies of the influence of the position of samples in production chamber to fatigue performance in finite life domain and fatigue limit of maraging steel MS1 obtained during the A_MADAM project. The outline of the table follows the notation and conventions described at the page Fatigue design rules for DMLS/SLM products. The position of samples with respect to the inert gas flow are denoted by column headers “V-up”, “V-mid” and “V-down” for samples in upstream, midstream and downstream positions.
| Post processing procedure (steps in order) | Production (orientation and position) | ||||
|---|---|---|---|---|---|
| 1st step | 2nd step | 3rd step | V up | V mid | V down |
| Maraging steel MS1 | |||||
| H-T | M 0.5mm | S-P | X | X | X |
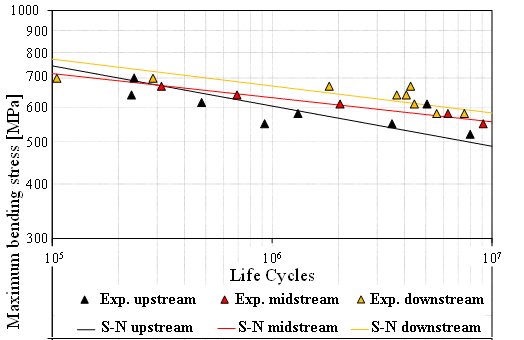
The comparison of the fatigue performances in the finite life domain of samples manufactured in different positions in production chamber is presented in the following figure, which suggests that the fatigue performance in the finite life domain of the samples in downstream positions (yellow triangles) is higher than the fatigue performance of the samples in midstream (red triangles) and upstream (black triangles) positions.
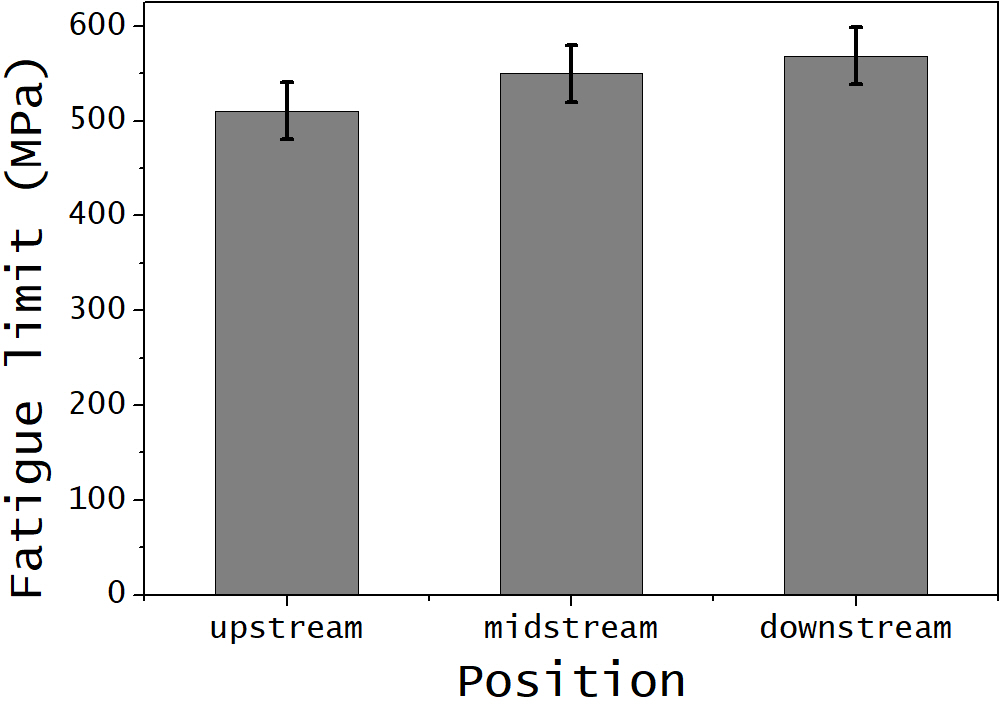
The comparison of the fatigue performances in the infinite life domain of samples manufactured in different positions in production chamber is presented in the following figure, which also suggests that the fatigue performance in the finite life domain of the samples in downstream positions (right bar) is higher than the fatigue performance of the samples in midstream (middle bar) and upstream (right bar) positions.
Statistical analyses of the presented data were not able to confirm that the observed trends are statistically relevant, which means that more data, or other methods of analysis, are needed to confirm an influence of the position of a maraging steel MS1 product within the production chamber to its fatigue performance. A recent analysis (completed in 2021) of the same data by application of artificial intelligence methods suggests the same conclusions, but with similar level of uncertainty.