Table of Contents
The influence of the build orientation to fatigue performance of DMLS/SLM products
This page discusses the influence of build orientation to fatigue performance of products made from different materials.
The influence of build orientation on fatigue performance of products manufactured by DMLS/SLM technology depends on material and post-processing procedures.
For testing samples that underwent recommended procedure for optimal fatigue performance, which consists of surface treatment by shot-peening, heat treatment and removal of a surface layer by machining (in that order), hold the following rules:
- Fatigue resistance of stainless steel PH1 products is higher if load and build direction make an acute angle, being the highest when the angle is 450.
- Fatigue resistances of maraging steel MS1 and maraging stainless steel CX products do not depend on the angle between the loading direction and build direction.
Mechanism of the influence
The build orientation determines the angle between the loading direction and orientation of the AM layers in microstructure of the material, and, consequently, affects the process of crack propagation due to dynamic loading of the product.
S-N curves and fatigue limits
The following figures and tables present the results of the studies of the influence of the build orientation of samples to fatigue performance in finite life domain and fatigue limit of maraging steel MS1, stainless steel PH1 and maraging stainless steel CX obtained during the A_MADAM project. The outline of the tables follows the notation and conventions described at the page Fatigue design rules for DMLS/SLM products. The build orientation of samples are denoted by column headers “V”, “H” and “S” for vertical, horizontal and slanted (with the angle of 45 degrees with horizontal) orientation of longitudinal axis of the samples.
Stainless steel PH1
The comparison of the fatigue performances in the finite life domain of samples manufactured with different orientations is presented in the following two figures, which suggest that:
- the influence of build orientation on fatigue performance is affected by post-processing and may be changed by thickness of allowance for machining
- the fatigue performances in the finite life domain of the samples manufactured with vertical (red circles) orientation of longitudinal axis is worse than fatigue performances of samples with horizontal (black circles) and slanted (green circles) orientations of longitudinal axes.
- the best fatigue performance of samples is obtained when build direction and loading direction make an angle 45 degrees.
The lines represent S-N curves. The top figure describes fatigue resistances of the samples with 1mm allowance for surface machining (processing code 1), while the bottom figure describes fatigue resistances of the samples with 3mm allowance for surface machining (processing code 3). Both figures illustrate independence of fatigue performance of MS1 on build orientation, and the independence on thickness of the allowance for machining is discussed in a dedicated page.
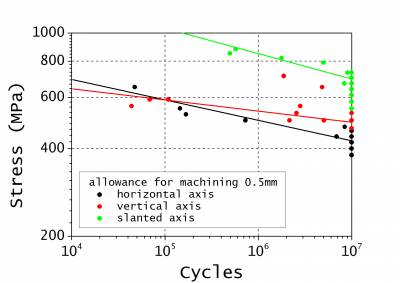
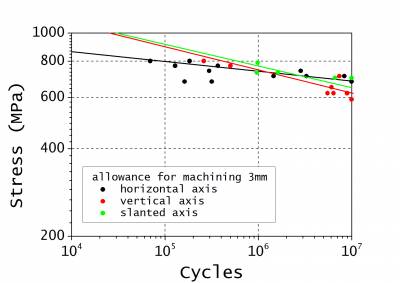
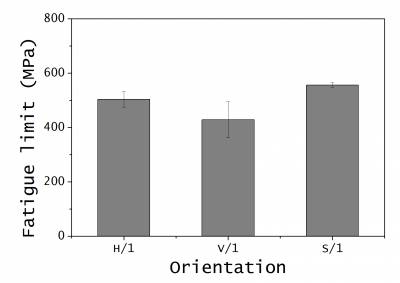
The comparison of the fatigue performances in the infinite life domain of samples manufactured with different orientations is presented in the following two figures. The orientations of the samples is indicated at the abscissa by the first letter, while the second letter represents the processing code.
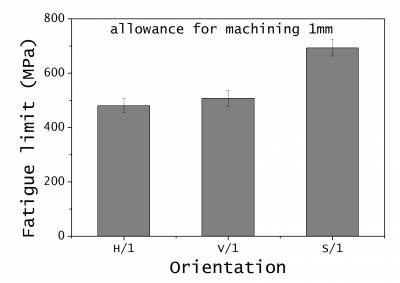
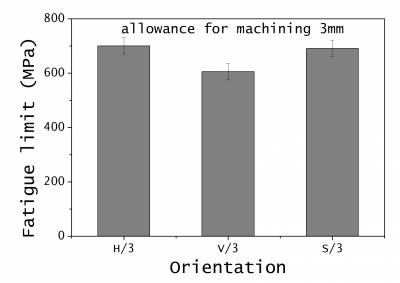 It is interesting to compare the determined fatigue limits (FL) to the ultimate tensile strengths (UTS) of the materials, considering that a FL/UTS ratio is approximately 50% for metallic materials obtained by other technologies. It may be noticed that removal of surface layer with thickness of 1mm leads so similar values for horizontal (H/1) and vertical (V/1) orientation of longitudinal axis during manufacturing, (37% and 39% of the UTS, respectively). However, the same thickness of allowance for machining (1mm) for slanted orientation of longitudinal axis during manufacturing leads to fatigue limits remarkably close to the 50% of UTS. Further increase of allowance for machining increases FL of the samples with horizontal orientation of longitudinal axis during manufacturing also to FLs close to the 50% of UTS. Such behavior shows that the fatigue response of the stainless steel PH1 is less sensitive to the additive manufacturing process than other maraging steel materials.
The S-N curves and the values of fatigue limits shown above may be seen at the pages dedicated to specific combinations of manufacturing conditions and post-processing procedures, listed in the table below.
| Post processing procedure (steps in order) | Production (orientation and position) | ||||
|---|---|---|---|---|---|
| 1st step | 2nd step | 3rd step | V | H | S |
| S-P | H-T | M 1mm | X | X | X |
| S-P | H-T | M 3mm | X | X | X |
The conclusions about the dependence of fatigue performance of PH1 products on build orientation are also confirmed by two-factor statistical analysis presented in the literature (Croccolo D, De Agostinis M, Fini S, Olmi G, Bogojevic N, Ciric-Kostic, S: “Effects of build orientation and thickness of allowance on the fatigue behaviour of 15–5 PH stainless steel manufactured by DMLS”, Fatigue & Fracture of Engineering Materials & Structures, download).
Maraging steel MS1
The comparison of the fatigue performances in the finite life domain of samples manufactured with different orientations is presented in the following two figures, which suggest that the fatigue performances in the finite life domain of the samples manufactured with vertical (red circles), horizontal (black circles) and slanted (green circles) orientations of longitudinal axes are similar. The lines represent S-N curves. The top figure describes fatigue resistances of the samples with 0.5mm allowance for surface machining (processing code M), while the bottom figure describes fatigue resistances of the samples with 3mm allowance for surface machining (processing code 3). Both figures illustrate independence of fatigue performance of MS1 on build orientation, and the independence on thickness of the allowance for machining is discussed in a dedicated page.
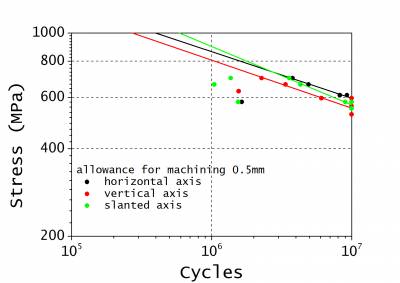
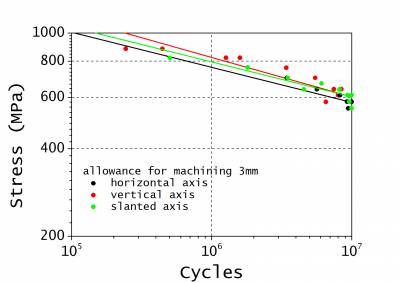
The comparison of the fatigue performances in the infinite life domain of samples manufactured with different orientations is presented in the following two figures. The orientations of the samples is indicated at the abscissa by the first letter, while the second letter represents the processing code. The figures also confirm independence of the fatigue performance of MS1 products on build orientation. The average value of the fatigue limit is 581MPa, corresponding to 28% the UTS of the studied material following the aging treatment.

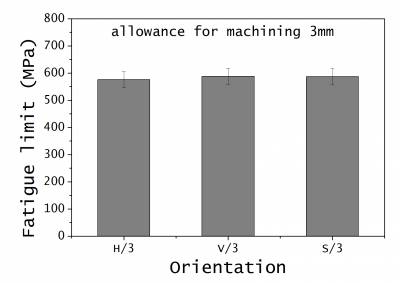
The S-N curves and the values of fatigue limits shown above may be seen at the pages dedicated to specific combinations of manufacturing conditions and post-processing procedures, listed in the table below.
| Post processing procedure (steps in order) | Production (orientation and position) | ||||
|---|---|---|---|---|---|
| 1st step | 2nd step | 3rd step | V | H | S |
| S-P | H-T | M 0.5mm | X | X | X |
| S-P | H-T | M 3mm | X | X | X |
The presented conclusion about independence of the fatigue performance of MS1 products on build orientation is also confirmed by two-factor statistical analysis presented in the literature (Dario Croccolo, Massimiliano De Agostinis, Stefano Fini, Giorgio Olmi, Francesco Robusto, Nusret Muharemović, Nebojša Bogojević Aleksandar Vranić, and Snežana Ćirić-Kostić. “Experimental study on the sensitivity of DMLS manufactured Maraging Steel fatigue strength to the build orientation and allowance for machining.” In Proceedings of the 6th International Conference Integrity-Reliability-Failure (IRF 2018), Lisbon, Portugal, pp. 971-986. 2018. download)).
Maraging stainless steel CX
The comparison of the fatigue performances in the finite life domain of samples manufactured with different orientations is presented in the following figure. While the differences between the fatigue performance in the finite life domain of the samples manufactured with vertical (red circles) orientation of longitudinal axis seems worse than fatigue performances of samples with horizontal (black circles) and slanted (green circles) orientations of longitudinal axes (similar to the case of stainless steel PH1), the statistical analysis could not exclude the possibility that the observed differences are random, so the influence of build orientation to the fatigue performance of maraging stainless steel CX may not be confirmed.
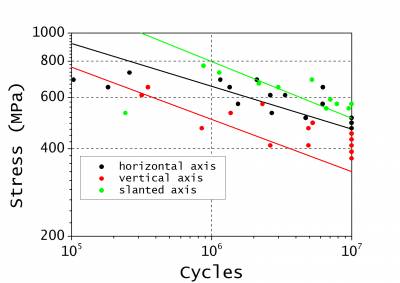
The comparison of the fatigue performances in the infinite life domain of samples manufactured with different orientations is presented in the following figure. The orientations of the samples is indicated at the abscissa.
The S-N curves and the values of fatigue limits shown above may be seen at the pages dedicated to specific combinations of manufacturing conditions and post-processing procedures, listed in the table below.
| Post processing procedure (steps in order) | Production (orientation and position) | ||||
|---|---|---|---|---|---|
| 1st step | 2nd step | 3rd step | V | H | S |
| S-P | H-T | M 0.5mm | X | X | X |
