Table of Contents
Fracture resistance of products of SLS technology
This page is the entry point of the future section dedicated to description of fatigue resistance of SLS materials. In the initial version, it contains the results of studies of fracture resistance of polyamide GF3200 in the A_MADAM project.
Fracture resistance of glass-filled polyamide GF3200
Fracture resistance of glass-filled polyamide GF3200 is determined experimentally, using the Inclined Edge Cracked Semi-Circular Bend (IACSB) specimen subjected to three-point bend loading. All the tested specimens were manufactured so that AM layers were in the plane of the specimen.
In order to obtain the various combinations of modes, only the parameters S2/R and α were varied in the testing campaign of A_MADAM project, while S2 was kept fixed at 42 mm, and the values of t, R and a were the same for all the specimens (t=6mm, R=60 mm, a=24 mm), except for three samples that had manually made notch. The various combinations of S2/R and α were used to achieve the fracture modes Mode I, Mode II and mixed modes I-II. When the bottom supports are located symmetrically to the crack line (i.e., when S1 = S2) and the crack line is in the same direction as the load (i.e., when α = 0°), the specimen is subjected to Mode I (opening mode). To obtain mixed mode I-II or Mode II (sliding mode), an appropriate combination of S1/R and α should be chosen.
Stress intensity factor (SFI) values were determined using J-integral and Critical Fracture Load (PCR) method, and the following table presents the obtained results for KI and KII. The first line of the table presents the result of the specimens with manually created notch. For explanation of the variables please see the explanation of the experimental method,
| Configuration | PCR | |||
|---|---|---|---|---|
| α (deg) | S1 (mm) | S2 (mm) | KI (MPa·m-1/2) | KII (MPa·m-1/2) |
| 0* | 42* | 42* | 2.74* | 0.0* |
| 0 | 42 | 42 | 3.13 | 0.0 |
| 10 | 3.00 | 1.11 | ||
| 18 | 2.72 | 2.91 | ||
| 10.2 | 0.67 | 3.68 | ||
*results of the specimens with manually created notch
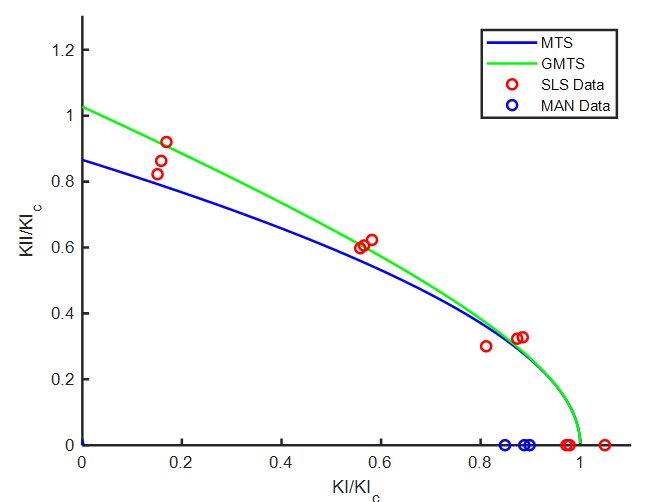
Fracture criterium
The obtained results may be interpreted within the framework of criteria based on maximum tangential stress, which are used for determining fracture toughness of brittle materials. The Maximum Tangential Stress (MTS) criterium has worse results than Generalized Maximum Tangential Stress (GMTS) criterion, as evidenced by the following figure, obtained using KIC=3.03MPa·m-1/2. The blue line (KIIC=2.58MPa·m-1/2) is obtained by fitting the data to MTS model, and green line (KIIC=3.09MPa·m−1/2) is obtained by fitting the data to GMTS model. Red circles represent results obtained using specimens with notches built during SLS production process, while blue circles represent results obtained using specimens with manually created notches.